6.9 KiB
socktop
socktop is a remote system monitor with a rich TUI interface, inspired by top and btop, that communicates with a lightweight remote agent over WebSockets.
It lets you watch CPU, memory, disks, network, temperatures, and processes on another machine in real-time — from the comfort of your terminal.
Features
- 📡 Remote monitoring via WebSocket — lightweight agent sends JSON metrics
- 🖥 Rich TUI built with ratatui
- 🔍 Detailed CPU view — per-core history, current load, and trends
- 📊 Memory, Swap, Disk usage — human-readable units, color-coded
- 🌡 Temperatures — CPU temperature with visual indicators
- 📈 Network throughput — live sparkline graphs with peak tracking
- 🏷 Top processes table — PID, name, CPU%, memory, and memory%
- 🎨 Color-coded load, zebra striping for readability
- ⌨ Keyboard shortcuts:
q/Esc→ Quit
Architecture
socktop has two components:
-
Agent (remote side)
A small Rust WebSocket server that runs on the target machine and gathers metrics via sysinfo. -
Client (local side)
The TUI app (socktop) that connects to the agent’s/wsendpoint, receives JSON metrics, and renders them.
The two communicate over a persistent WebSocket connection.
Adaptive (idle-aware) sampling
The socktop agent now samples system metrics only when at least one WebSocket client is connected. When idle (no clients), the sampler sleeps and CPU usage drops to ~0%.
How it works
- The WebSocket handler increments/decrements a client counter in
AppStateon connect/disconnect. - A background sampler wakes when the counter transitions from 0 → >0 and sleeps when it returns to 0.
- The most recent metrics snapshot is cached as JSON for fast responses.
Cold start behavior
- If a client requests metrics while the cache is empty (e.g., just started or after a long idle), the agent performs a one-off synchronous collection to respond immediately.
Tuning
- Sampling interval (active): update
spawn_sampler(state, Duration::from_millis(500))insocktop_agent/src/main.rs. - Always-on or low-frequency idle sampling: replace the “sleep when idle” logic in
socktop_agent/src/sampler.rswith a low-frequency interval. Example sketch:
// In sampler.rs (sketch): sample every 10s when idle, 500ms when active
let idle_period = Duration::from_secs(10);
loop {
    let active = state.client_count.load(Ordering::Relaxed) > 0;
    let period = if active { Duration::from_millis(500) } else { idle_period };
    let mut ticker = tokio::time::interval(period);
    ticker.tick().await;
    if !active {
        // wake early if a client connects
        tokio::select! {
            _ = ticker.tick() => {},
            _ = state.wake_sampler.notified() => continue,
        }
    }
    let m = collect_metrics(&state).await;
    if let Ok(js) = serde_json::to_string(&m) {
        *state.last_json.write().await = js;
    }
}
Installation
Prerequisites
- Rust 1.75+ (recommended latest stable)
- Cargo package manager
Build from source
git clone https://github.com/YOURNAME/socktop.git
cd socktop
cargo build --release
Install as a cargo binary
cargo install --path .
This will install the socktop binary into ~/.cargo/bin.
Running
1. Start the agent on the remote machine
The agent binary listens on a TCP port and serves /ws:
remote_agent 0.0.0.0:8080
Tip: You can run the agent under
systemd, inside a Docker container, or just in a tmux/screen session.
2. Connect with the client
From your local machine:
socktop ws://REMOTE_HOST:8080/ws
Example:
socktop ws://192.168.1.50:8080/ws
Usage
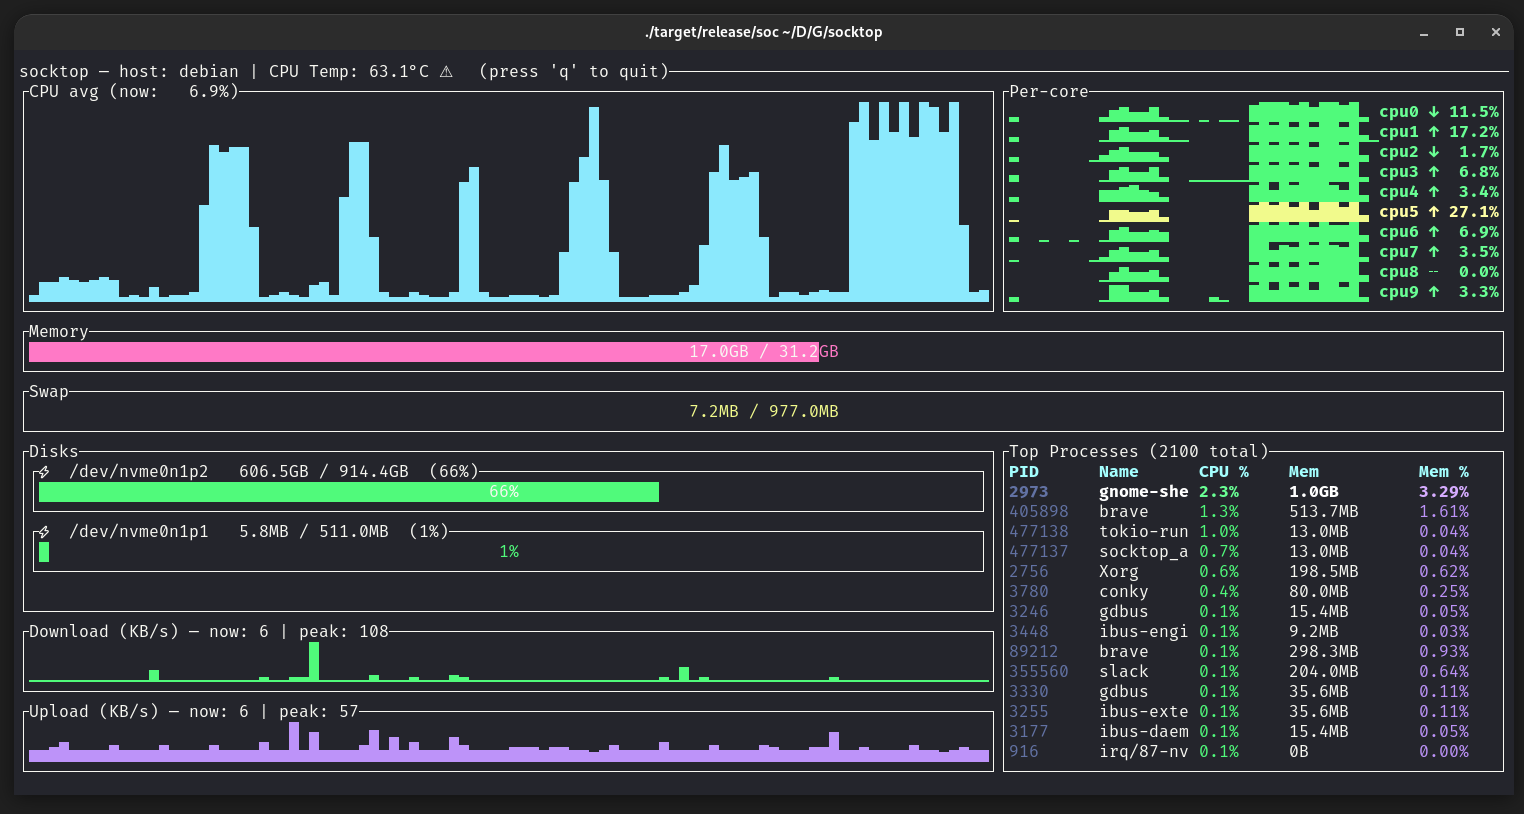
When connected, socktop displays:
Left column:
- CPU avg graph — sparkline of recent overall CPU usage
- Memory gauge — total and used RAM
- Swap gauge — total and used swap
- Disks — usage per device (only devices with available space > 0)
- Network Download/Upload — sparkline in KB/s, with current & peak values
Right column:
- Per-core history & trends — each core’s recent load, current %, and trend arrow
- Top processes table — top 20 processes with PID, name, CPU%, memory usage, and memory%
Configuring the agent port
The agent listens on TCP port 3000 by default. You can override this via a CLI flag, a positional port argument, or an environment variable:
- CLI flag:
- socktop_agent --port 8080
- socktop_agent -p 8080
- Positional:
- socktop_agent 8080
- Environment variable:
- SOCKTOP_PORT=8080 socktop_agent
Help:
- socktop_agent --help
The TUI should point to ws://HOST:PORT/ws, e.g.:
- cargo run -p socktop -- ws://127.0.0.1:8080/ws
Keyboard Shortcuts
| Key | Action |
|---|---|
q or Esc |
Quit |
Security (optional token)
By default, the agent exposes metrics over an unauthenticated WebSocket. For untrusted networks, set an auth token and pass it in the client URL:
- Server:
- SOCKTOP_TOKEN=changeme socktop_agent --port 3000
- Client:
- socktop ws://HOST:3000/ws?token=changeme
Platform notes
- Linux x86_64/AMD/Intel: fully supported.
- Raspberry Pi:
- 64-bit: rustup target add aarch64-unknown-linux-gnu; build on-device for simplicity.
- 32-bit: rustup target add armv7-unknown-linux-gnueabihf.
- Windows:
- TUI and agent build/run with stable Rust. Use PowerShell:
- cargo run -p socktop_agent -- --port 3000
- cargo run -p socktop -- ws://127.0.0.1:3000/ws
- CPU temperature may be unavailable; display will show N/A.
- TUI and agent build/run with stable Rust. Use PowerShell:
Example agent JSON
socktop expects the agent to send metrics in this shape:
{
  "cpu_total": 12.4,
  "cpu_per_core": [11.2, 15.7, ...],
  "mem_total": 33554432,
  "mem_used": 18321408,
  "swap_total": 0,
  "swap_used": 0,
  "process_count": 127,
  "hostname": "myserver",
  "cpu_temp_c": 42.5,
  "disks": [{"name":"nvme0n1p2","total":512000000000,"available":320000000000}],
  "networks": [{"name":"eth0","received":12345678,"transmitted":87654321}],
  "top_processes": [
    {"pid":1234,"name":"nginx","cpu_usage":1.2,"mem_bytes":12345678}
  ]
}
Development
Run in debug mode:
cargo run -- ws://127.0.0.1:8080/ws
Code formatting & lint:
cargo fmt
cargo clippy
Roadmap
- Configurable refresh interval
- Filter/sort top processes in the TUI
- Export metrics to file
- TLS / WSS support
- Agent authentication
License
MIT License — see LICENSE.
Acknowledgements
ratatuifor terminal UI renderingsysinfofor system metricstokio-tungstenitefor WebSocket client/server